quantcast-growth {xs} Next>
quantcast-growth {sm} Next>
quantcast-growth {md} Next>
quantcast-growth {lg} Next>
quantcast-growth {xl} Next>
quantcast-growth {xxl} Next>

Quantcast Growth

Product Experiments
and Digitl Marketing

2017-2018

Overview


Growing the self-serve customer base through A/B experiments and digital marketing

Team: Product Marketers, Analytics, User Researcher, Software Engineer
Role: Designer

Info


The Growth team was responsible for growing the self-serve customer base in Measure, our website audience analytics tool. To achieve this, we ran A/B tests on the product, sent onboarding emails to support Measure "pixel" installation, informed users about new features through product emails, created blog content, and conducted user research.

Digital Marketing


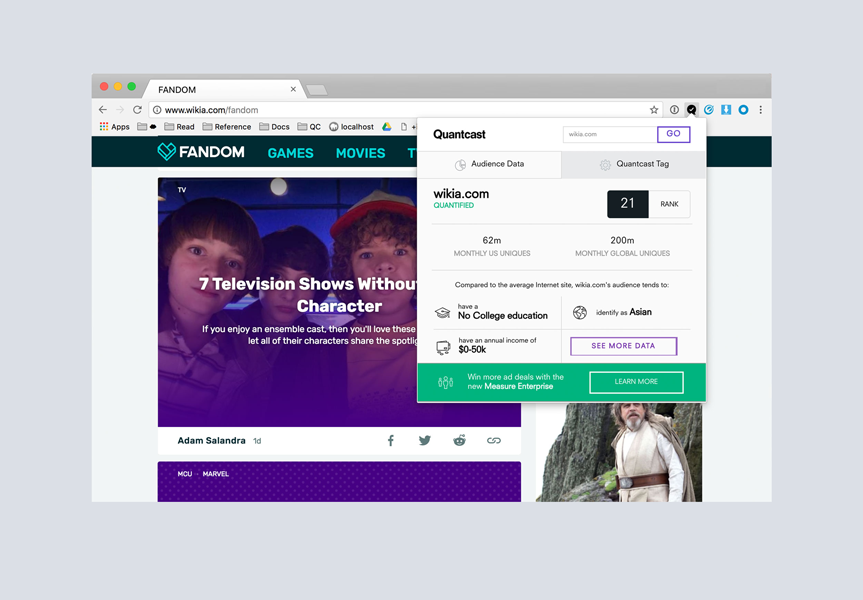
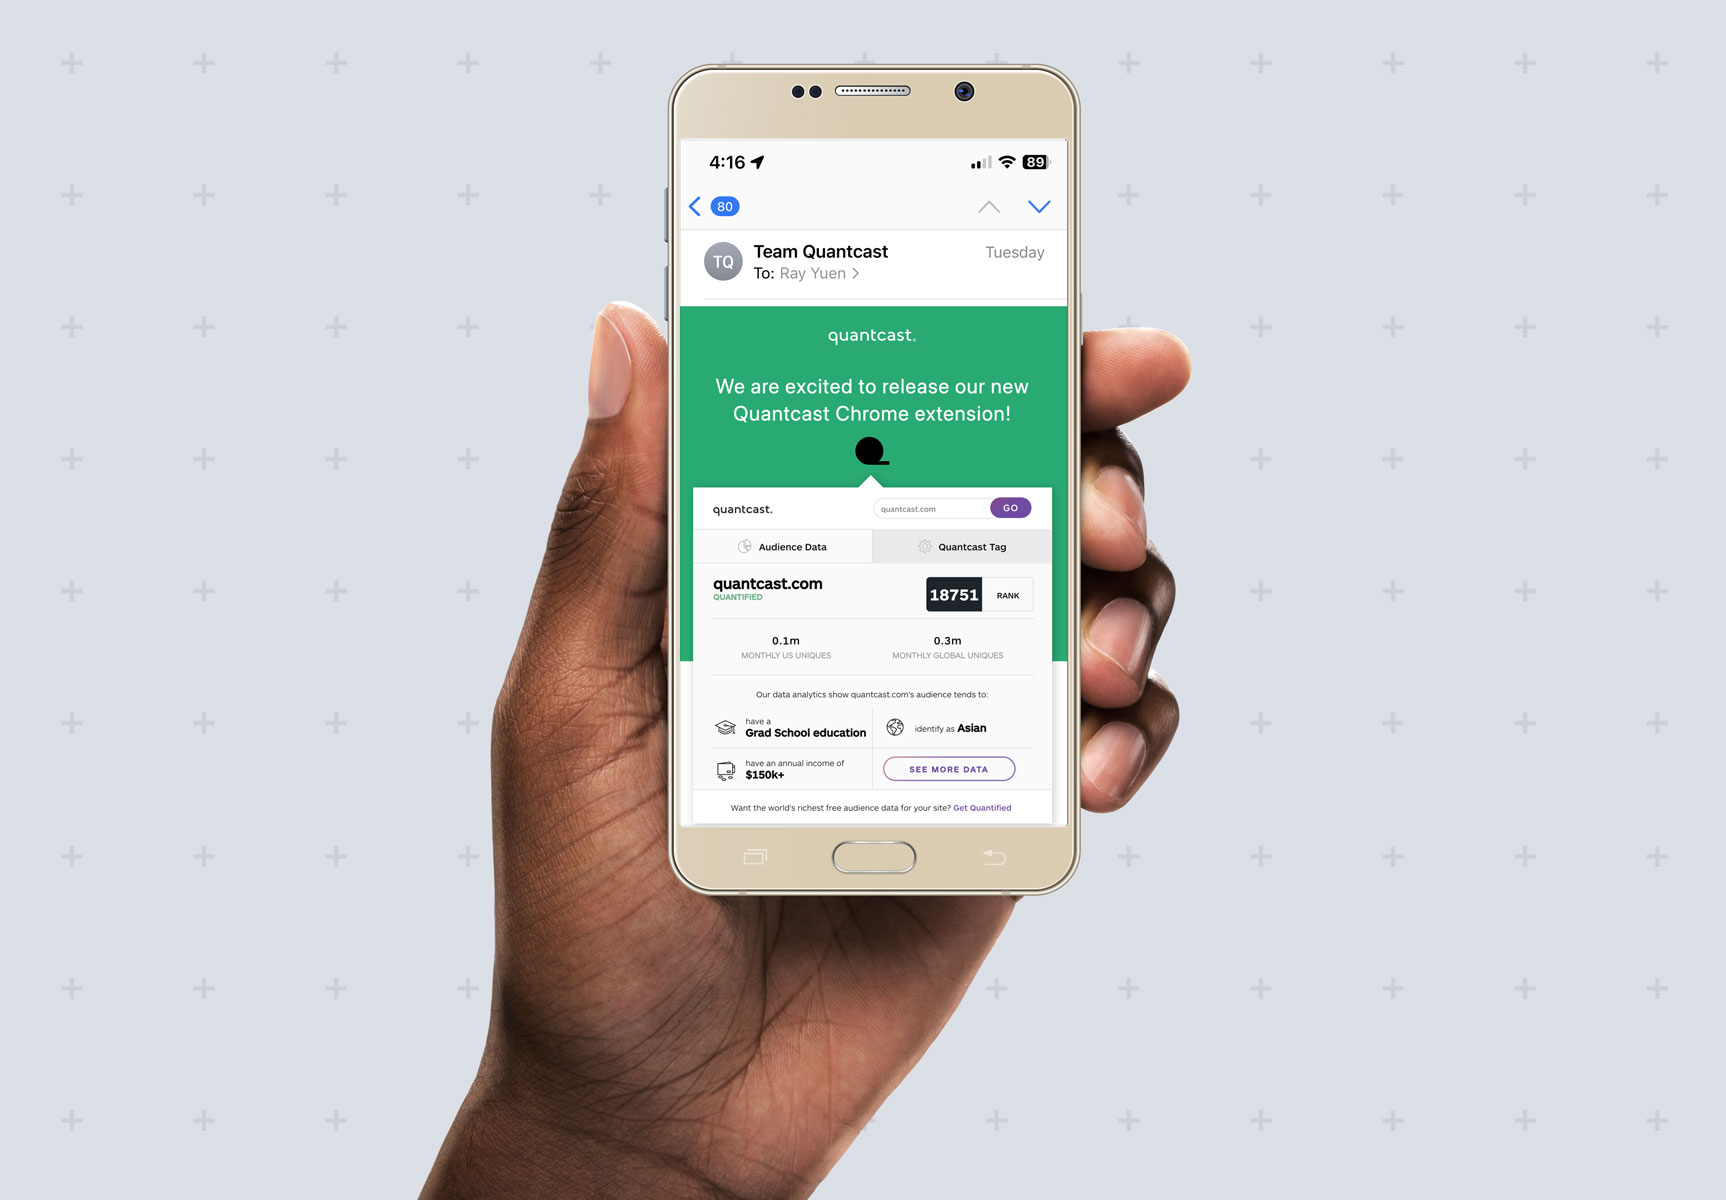
Product Announcement Emails

Content Segments A
enhance >
Content Segments B
enhance >

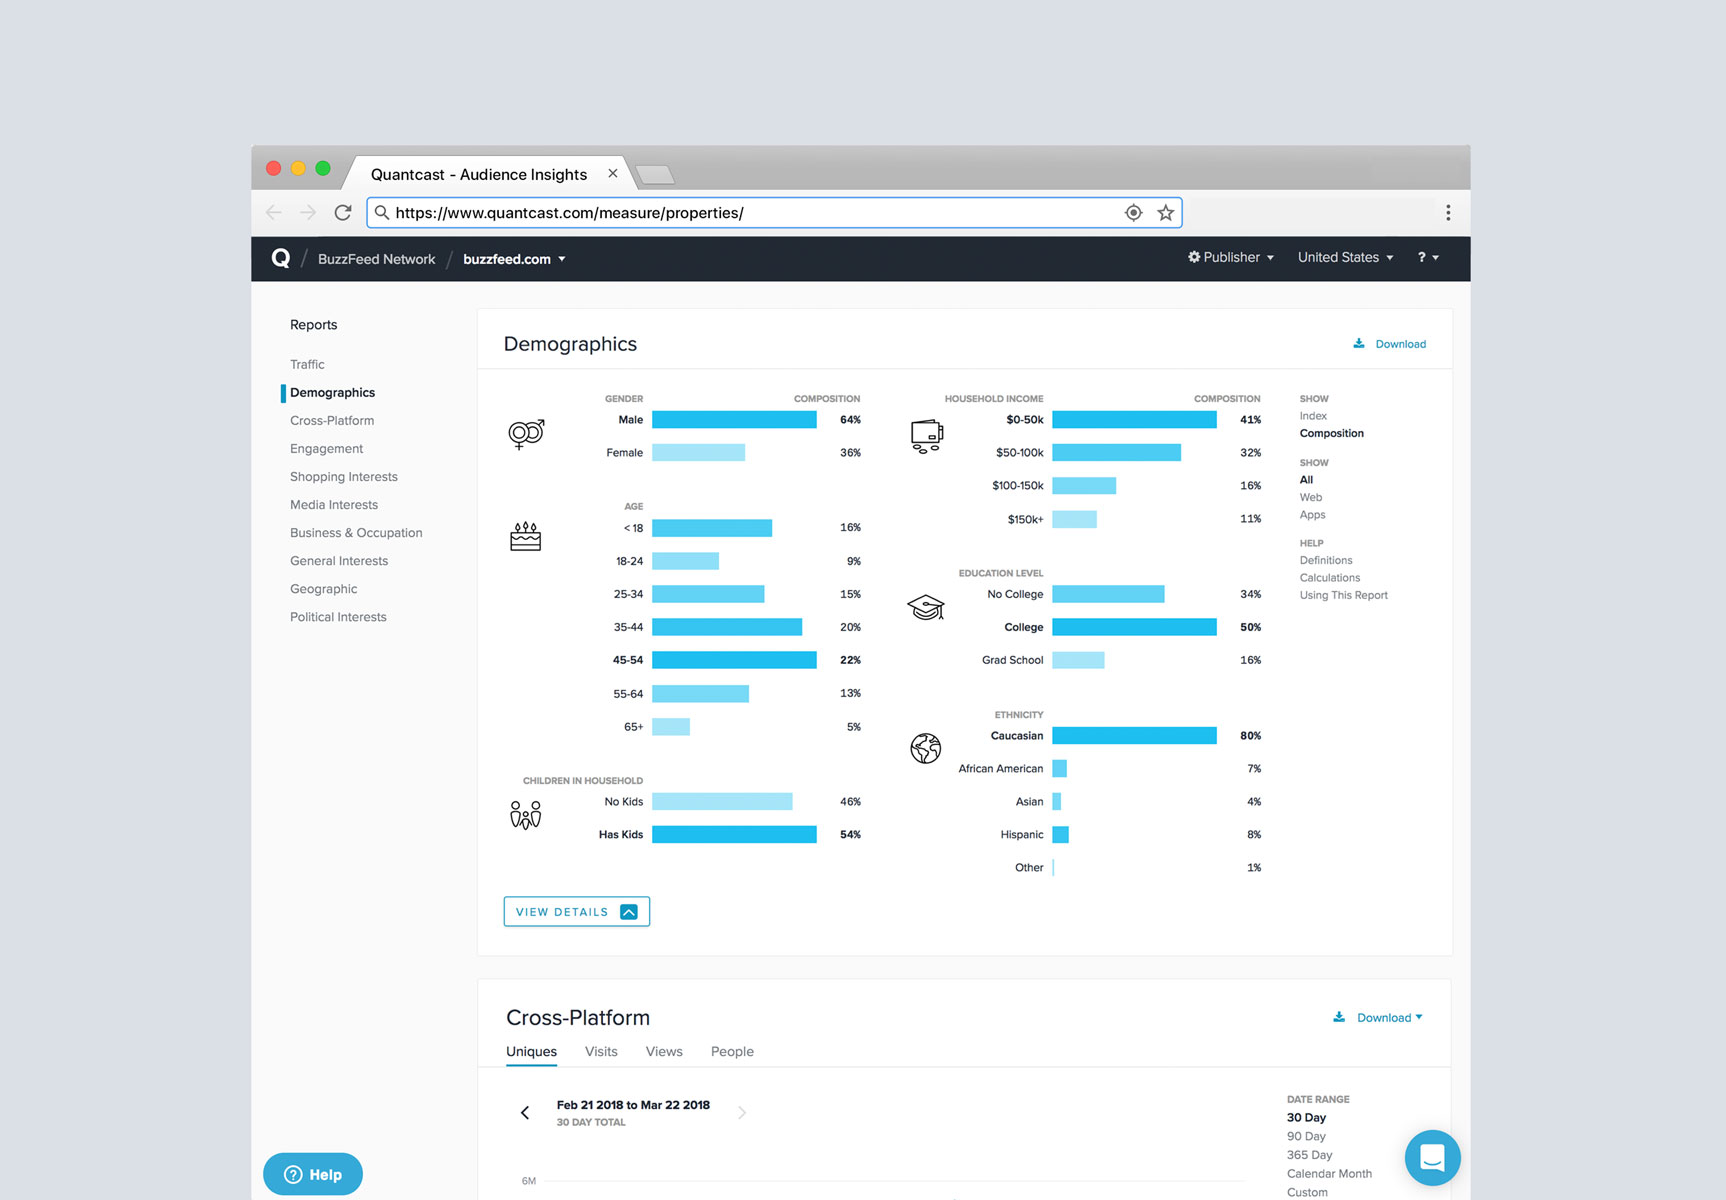
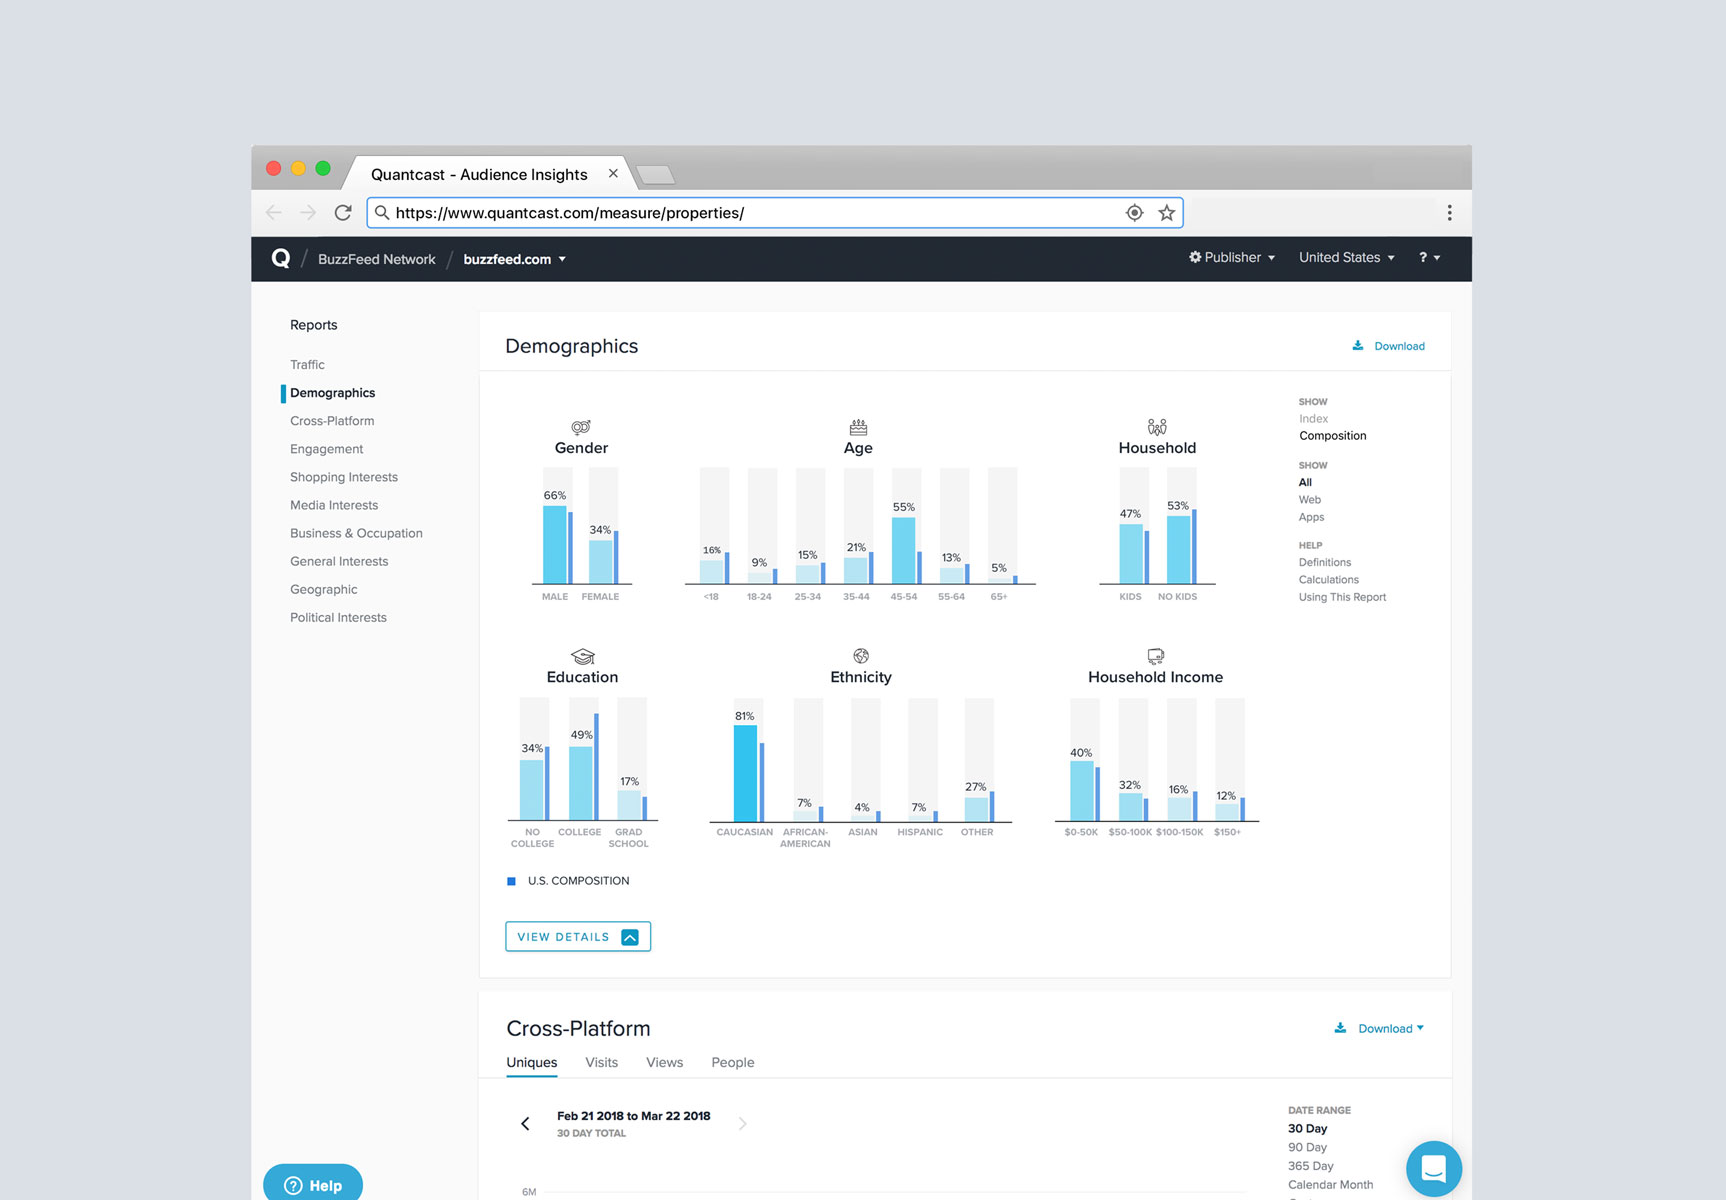
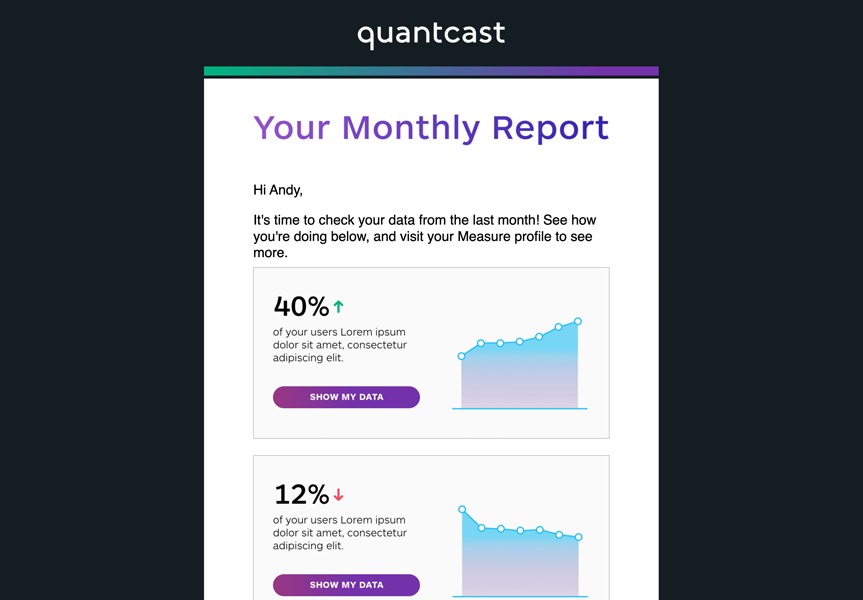
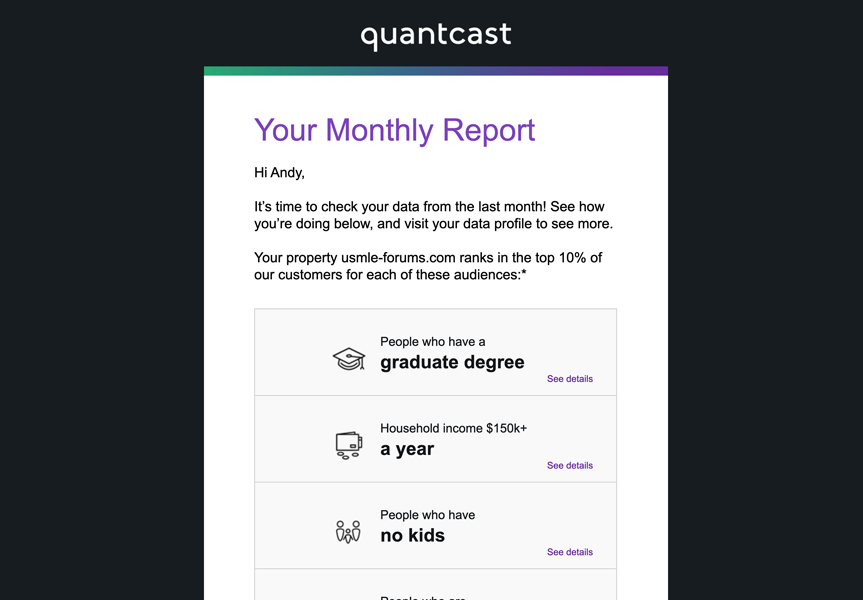
Monthly Report Emails

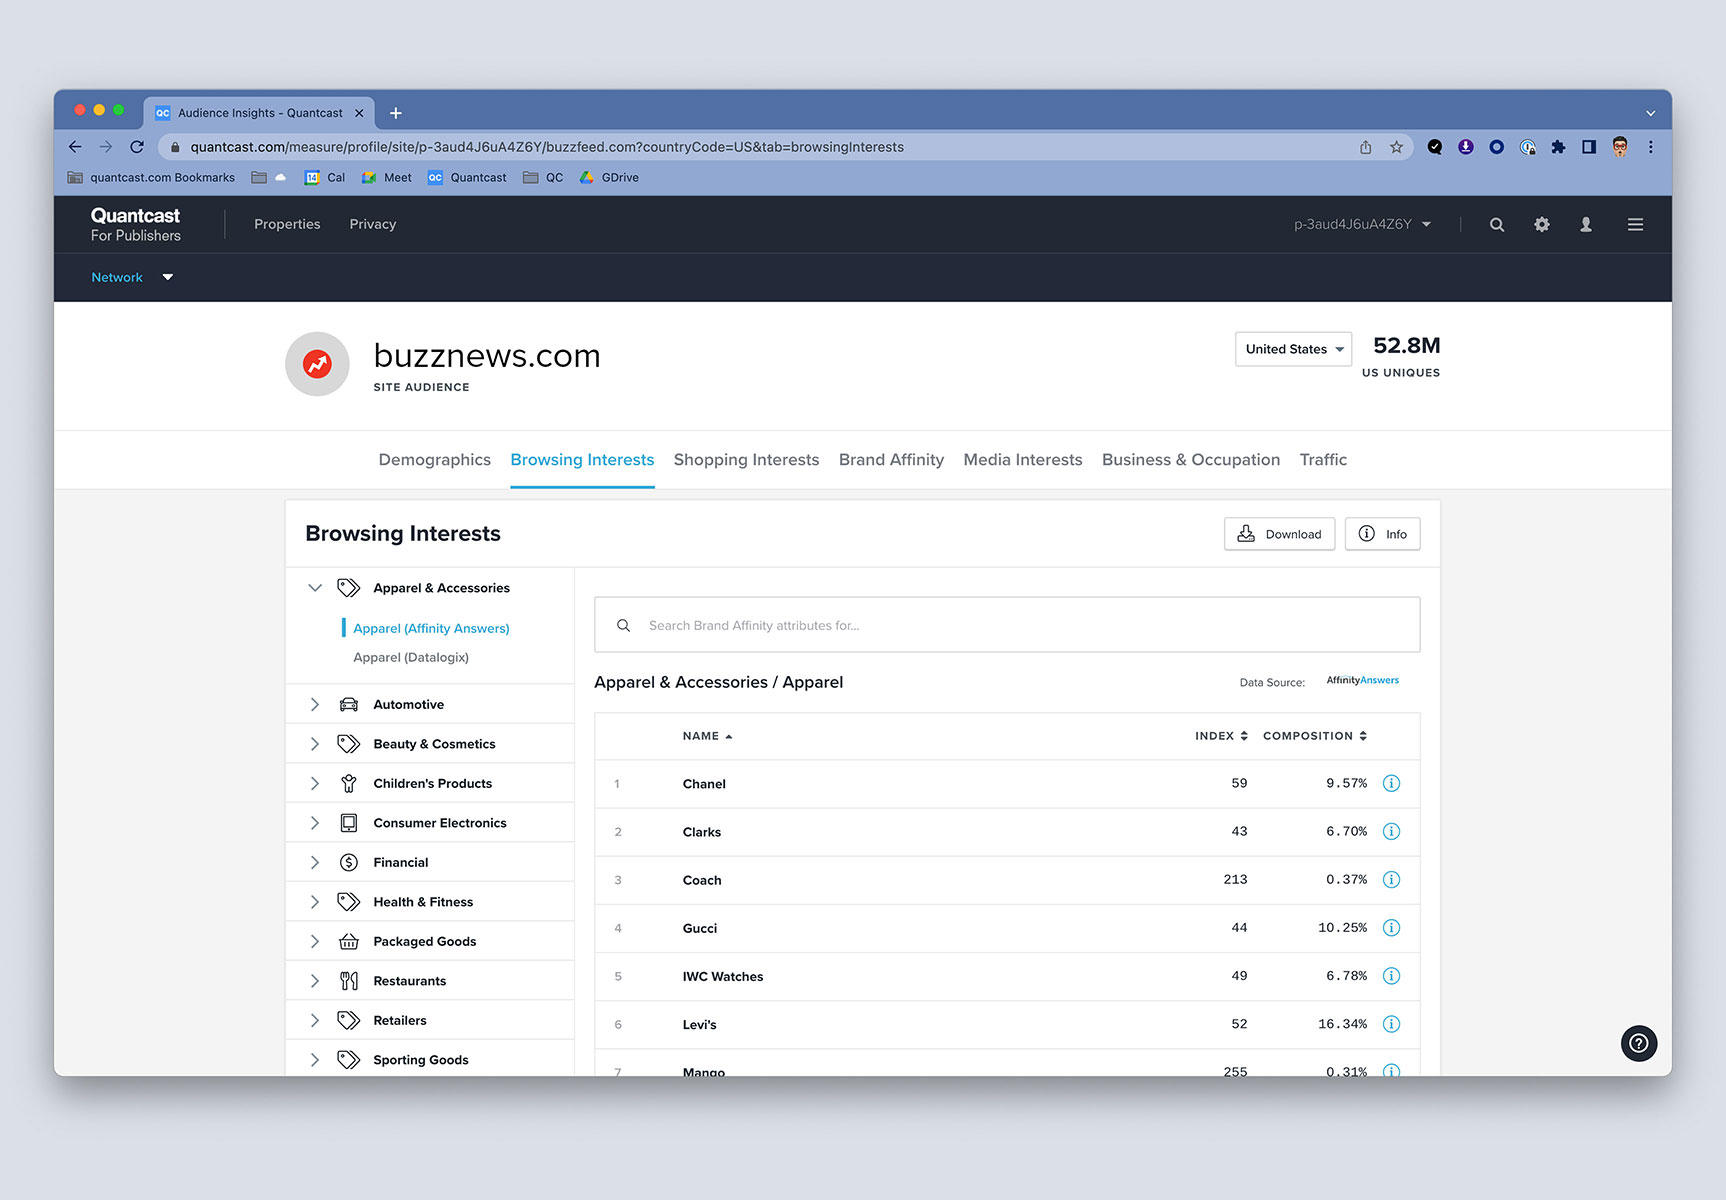
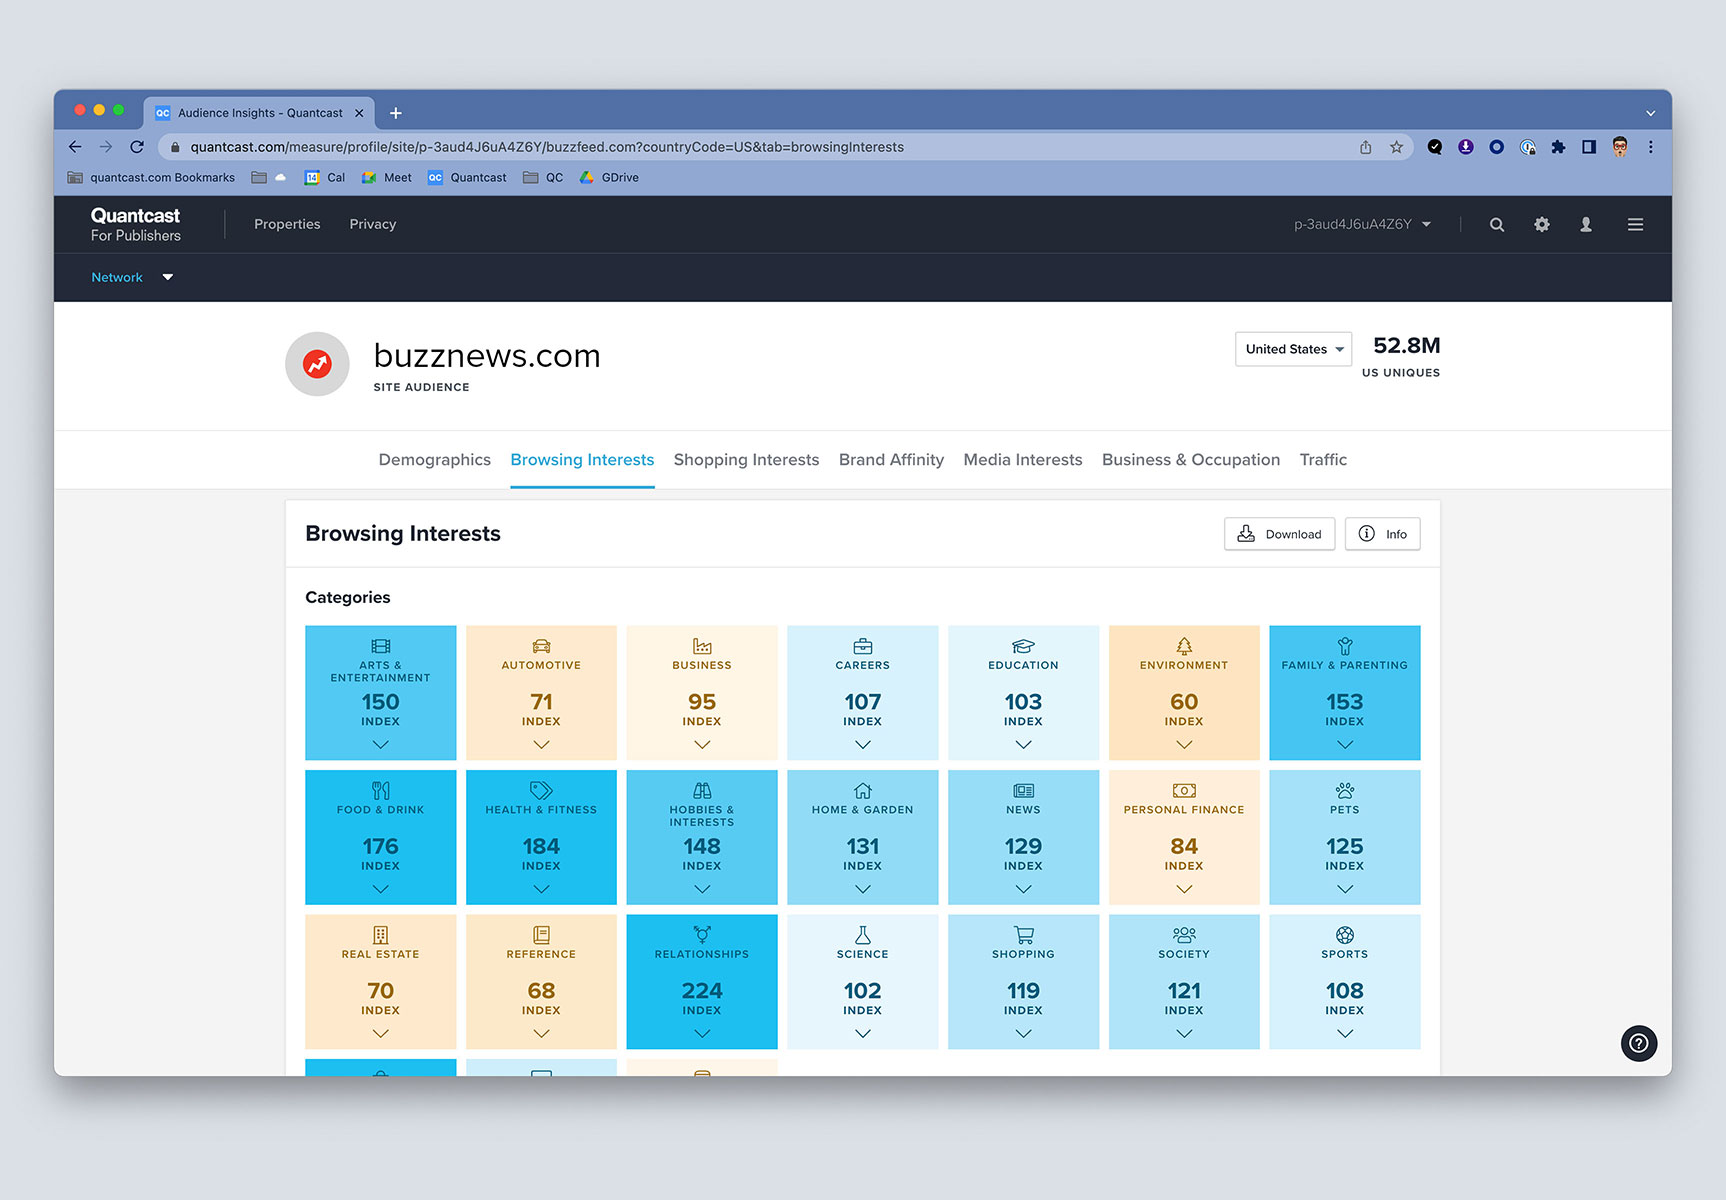
We manually sent monthly data reports to users to increase to engage with their profiles. These reports were built using data pulls (since our product did not have that feature) so we the challenge was to build graphics that weren't individualized.

image1
Monthly Report v1 with traffic data
see the full email >
image1
Monthly Report v2 with audience data
see the full email >

Experiments


Quantcast Measure Chrome Extension

In order to extend the functionality of Measure, we built a Chrome extension that showed basic traffic and demographic data, allowed you conduct basic market research on websites, and helped with the tag/pixel installation process.

image1
Chrome extension on a site with a working Quantcast Measure tag/pixel
image1
Product announcement email

Module Redesign in the Analytics Tool

One of our more notable experiments involved the redesign of the Browsing Interests tab in Measure. The audience interest tabs consisted of expandable charts, so we tested a more visual design featuring shades of color resembling a heatmap to convey audience interest. This redesign also enhanced the tab's usability, providing users with swift access to insightful information at a glance. The data revealed a substantial increase in usage, leading to the successful integration of this experiment into our product, rather than implementing it through an Optimizely hack.

Measure Browsing Before
Measure - Interest Browsing - Before
Measure Browsing After
Measure - Interest Browsing - After

Demographics Redesign

A reimagining of the Demographics tab in Measure. An exercise in trying to have the user click less to see the 2 main data points, index and composition.

image1
Demographics - Before
image1
Redesigned Demographics

Measure Onboarding

We conducted numerous successful experiments on the initial product setup screen, which resulted in making this screen more useful (it was essentially a blank state before). Our primary objective was to enhance the success rate of tag installations. Once a tag is placed on a website, it usually takes a few days for the data to begin appearing. During this waiting period, we provided support content and facilitated browsing other quantified sites as a way to engage and assist our users.

sign-in

Retrospective


Final Thoughts & Takeaways

1

Embracing Data-Driven Design: Joining the Growth team marked my initiation into making design decisions grounded in data. This approach provided a systematic method of collecting, analyzing, and interpreting relevant data.

2

It's fun to build things and understand how they work! After recently beginning my journey into learning the fundamentals of PHP and Javascript, I found the idea of partnering with an engineer to collaboratively build and iterate on projects incredibly enticing.

3

Continuous improvement. Even if something performed well, if we have the time, we keep testing for more data and iterative improvement. Tests can be as simple as changing text to see what resonates better.


Next Project

quantcast.com

Maintaining the website design system and boosting demand-gen efforts